Template
Small Business Pricing Worksheet (Free, Copy-Paste)
Most pricing advice ends before the part that's actually hard: sitting down with your own numbers and filling in the lines. This page is the worksheet for that — two of them, one for products and one for services, both copy-paste, both free, neither of them behind an email form.
The reason to do this on paper rather than in your head is that pricing errors don't announce themselves. They show up months later as a cash shortage. JPMorgan Chase Institute's study of 597,000 small businesses found the median one held a cash buffer of just 27 days of typical outflows — 16 days for restaurants, 19 for retail. (That research was published in September 2016, so treat the exact figures as a snapshot rather than today's number; the structural point that small business buffers are measured in weeks has not changed.) A buffer that thin is refilled by one thing only, and that thing is margin.
How to use this worksheet
Copy the block that matches what you sell, paste it into a note or a spreadsheet, and fill in the bracketed values. Every line has a reason to exist — the sections below explain the three that people get wrong.
Two rules before you start:
- Use real numbers, not estimates you'd be embarrassed to defend. "About five dollars in materials" is how underpricing begins. Weigh it, count it, look it up.
- Do it per unit, or per hour, and never per month. Monthly totals hide the per-sale economics, and per-sale economics are what you actually set a price on.
The product pricing worksheet
PRODUCT PRICING WORKSHEET
Product: [name]              Unit: [1 bottle / 1 case / 1 job]
Date: [YYYY-MM-DD]

1. DIRECT MATERIALS (per unit)
   [Component]                          [$0.00]
   [Component]                          [$0.00]
   [Packaging / label / insert]         [$0.00]
   A. Materials subtotal                [$0.00]

2. DIRECT LABOR (per unit)
   Batch size                           [__ units]
   Hours per batch                      [__ hrs]
   Labor rate (incl. payroll tax)       [$0.00 /hr]
   B. Labor per unit                    [$0.00]
      = (hours x rate) / batch size

3. OVERHEAD (per unit)
   Monthly overhead total               [$0.00]
      rent, insurance, utilities, software,
      licences, equipment amortization
   Expected units sold per month        [__ units]
   C. Overhead per unit                 [$0.00]
      = monthly overhead / monthly units

   D. TOTAL COST PER UNIT               [$0.00]
      = A + B + C

4. SELLING COSTS (variable, per sale)
   Card / processing fee                [_._% + $0.__]
   Marketplace or platform fee          [_._%]
   Shipping not billed to customer      [$0.00]
   Expected returns / breakage          [_._%]

5. TARGET MARGIN
   Target gross margin                  [__%]

6. PRICE
   Naive price (ignores line 4)         [$0.00]
      = D / (1 - margin)
   True price (covers line 4)           [$0.00]
      = (D + fixed fees) / (1 - margin - percentage fees)
   Rounded shelf price                  [$0.00]

7. IF YOU ALSO WHOLESALE
   Target wholesale margin              [__%]
   Wholesale price = D / (1 - wholesale margin)   [$0.00]
   Implied retail (2 x wholesale)                 [$0.00]

8. SENSE CHECK
   Actual margin at rounded price       [__%]
   Break-even units per month           [__ units]
   Nearest competitor price             [$0.00]
The service pricing worksheet
If you sell your time rather than units, the build-up runs the other way: you start from what the year has to produce and divide by the hours you can actually bill.
SERVICE / HOURLY RATE WORKSHEET
Business: [name]        Year: [YYYY]

1. WHAT THE YEAR MUST PRODUCE
   Target income (living + retirement + health)  [$0]
   Business expenses (annual, not monthly)       [$0]
   E. Subtotal to cover                          [$0]

2. TAX
   Set-aside rate (ask your accountant)          [__%]
   F. Total to bill = E / (1 - rate)             [$0]
      NOTE: divide by (1 - rate). Multiplying
      by the rate leaves you short.

3. PROFIT BUFFER
   Buffer rate (10-20% is a normal choice)       [__%]
   G. Annual billing target = F x (1 + buffer)   [$0]

4. BILLABLE HOURS (the line most people halve too late)
   Weeks worked per year (52 - vacation - sick)  [__ wks]
   Working hours per week                        [__ hrs]
   Gross working hours                           [__ hrs]
   Billable ratio (measure it, don't guess)      [__%]
   H. Billable hours per year                    [__ hrs]

5. RATE
   Hourly rate = G / H                           [$0]
   Rounded rate                                  [$0]
   Day rate (rate x billable hours per day)      [$0]

6. SENSE CHECK
   Rate vs comparable providers                  [$0 - $0]
   Minimum project size worth taking             [$0]
   Next rate review date                         [YYYY-MM-DD]
The three lines people get wrong
Overhead per unit
Direct materials are easy to count, so they get counted. Rent, insurance, and software are not attached to any single sale, so they get left out entirely — and then the business is puzzled about why a 60% "margin" produces no money at the end of the month.
Allocate overhead by dividing your monthly overhead total by the units you realistically expect to sell that month. Be conservative on the unit count. If you divide $880 of overhead across the 2,000 units you hope to sell rather than the 800 you actually sell, you have hidden $0.66 of cost in every single unit.
Card processing and platform fees
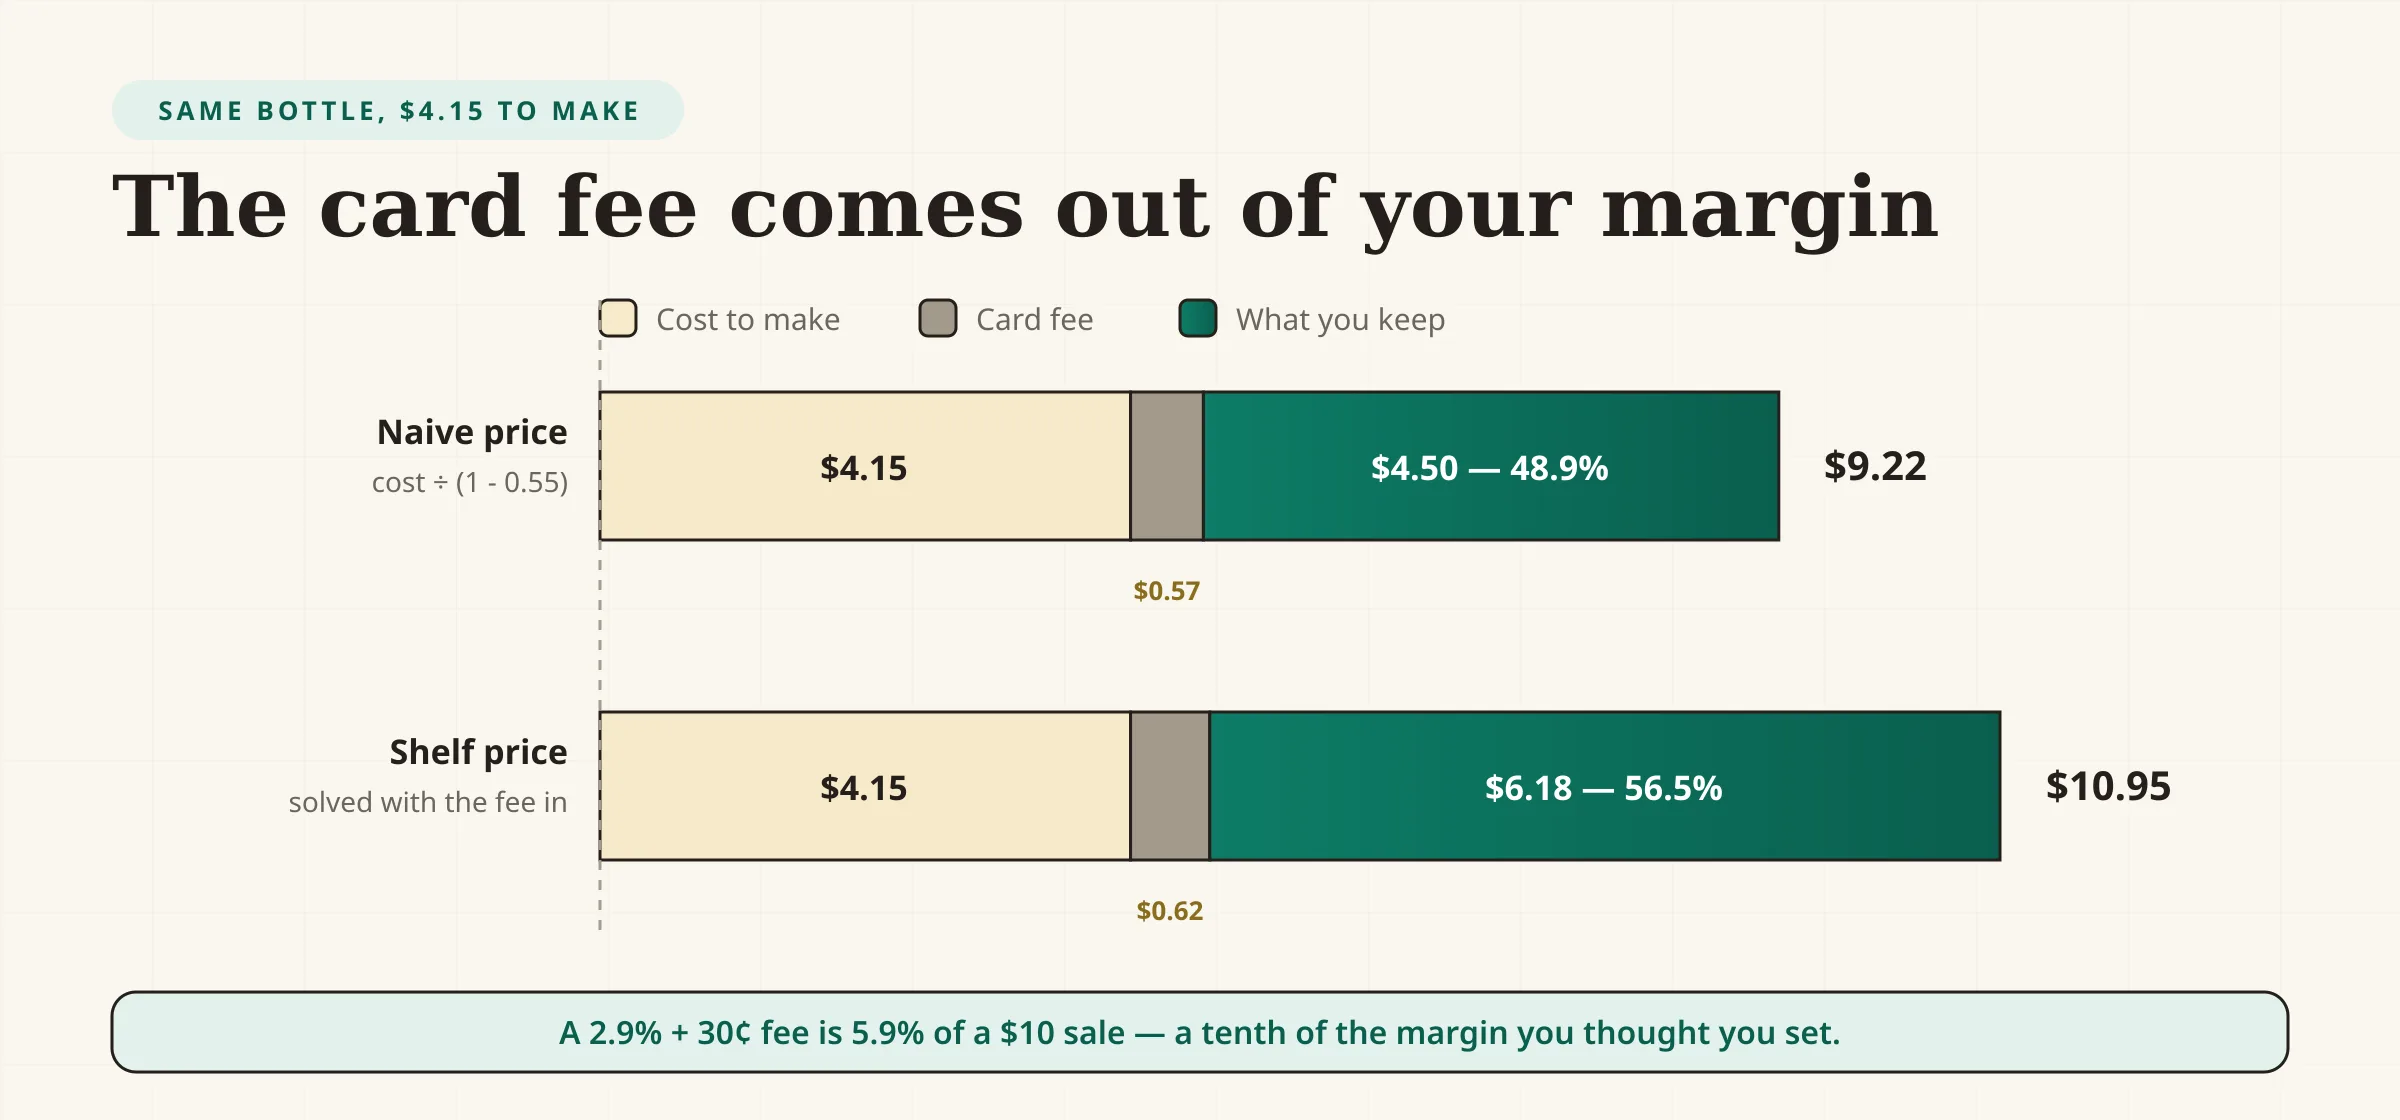
A card fee of 2.9% + 30¢ sounds trivial. On a $10 product it is 5.9% of the price — more than a tenth of a 55% margin, gone.
These belong in the price, not in a general sense of disappointment at the end of the month. The worksheet handles them by solving for price rather than marking up cost, which is the difference between the "naive price" and "true price" lines:
Our payment processors guide covers how those percentages differ between providers and how to work out your real effective rate.
Margin vs markup
Dividing by (1 − margin) is not the same as multiplying by (1 + margin), and the gap is not small. A $4.15 cost at a "55%" markup gives $6.43. At a 55% *margin* it gives $9.22. If you set the first while believing you set the second, you are running at 35% margin and don't know it.
This is the single most expensive arithmetic error in small business pricing, and it has its own guide: markup vs margin.
Worked example: a hot sauce maker
Copper Kettle makes a 5 oz bottle, sells direct at a market and online, and is considering wholesale. Here is the product worksheet filled in.
| Line | Item | Amount |
|---|---|---|
| 1 | Peppers and produce | $0.95 |
| 1 | Vinegar, salt, spices | $0.28 |
| 1 | Bottle and cap | $0.62 |
| 1 | Label | $0.14 |
| 1 | Shrink band | $0.05 |
| A | Materials subtotal | $2.04 |
| 2 | 5.5 hrs per 120-bottle batch at $22/hr | $121.00 |
| B | Labor per unit ($121 ÷ 120) | $1.01 |
| 3 | Monthly overhead (kitchen rent $650, insurance $85, utilities $70, software $45, permits $30) | $880.00 |
| 3 | Expected units per month | 800 |
| C | Overhead per unit ($880 ÷ 800) | $1.10 |
| D | Total cost per unit | $4.15 |
Now the price. Copper Kettle wants a 55% gross margin, and takes cards at 2.9% + 30¢.
The naive calculation is $4.15 ÷ (1 − 0.55) = $9.22. But at $9.22 the card fee is $0.57, which makes the real cost $4.72 and the real margin 48.9% — six points below target.
Solving properly:
Price = ($4.15 + $0.30) ÷ (1 − 0.55 − 0.029) = $4.45 ÷ 0.421 = $10.57
Rounded to a shelf price of $10.95, the actual margin is 56.5%.
The Profit Margin Calculator confirms the result in one step, and the Break-Even Calculator turns the $880 of monthly overhead into the units-per-month figure the last line of the worksheet asks for.
The wholesale trap
Copper Kettle is asked by a local grocer for wholesale pricing at the standard 50% of retail. At a $10.95 shelf price that means $5.48 a bottle — against a $4.15 cost, a margin of 24%, before the extra labor of packing cases and invoicing.
That is the trap in line 7, and it is why the worksheet asks for the wholesale number *before* you settle on retail. Run it the other way: a wholesale price that clears 40% margin is $4.15 ÷ 0.60 = $6.92, which implies a retail price near $13.95.
The decision isn't "should I wholesale?" — it's "is my retail price high enough that wholesale is survivable?" Most makers discover the answer is no only after they have printed the labels.
Worked example: a freelance bookkeeper
The service worksheet runs in the other direction. Dana is going independent and needs a rate.
| Line | Item | Amount |
|---|---|---|
| 1 | Target income (living, retirement, health cover) | $66,000 |
| 1 | Business expenses (software, insurance, licence, phone) | $8,400 |
| E | Subtotal to cover | $74,400 |
| 2 | Tax set-aside at 25% (her accountant's figure) | $24,800 |
| F | Total to bill ($74,400 ÷ (1 − 0.25)) | $99,200 |
| 3 | Profit buffer at 12% | $11,904 |
| G | Annual billing target | $111,104 |
| 4 | 46 weeks × 40 hrs = 1,840 gross hours, measured 62.5% billable | 1,150 hrs |
| H | Hourly rate ($111,104 ÷ 1,150) | $97 |
The two lines that decide this number are the tax division and the billable ratio. Dividing by (1 − 0.25) rather than multiplying by 0.25 is worth $6,200 a year to Dana. And the billable ratio is what separates $97 from the $60 she would have reached by dividing her target by 1,840 hours she was never going to bill.
Common mistakes
- Pricing off a competitor without knowing your own cost. Their cost structure isn't yours. Matching a price you can't afford is how a business loses money on every sale and tries to make it up in volume.
- Paying yourself out of what's left. Your labor is a cost line, not a residual. If line 2 is zero because "it's just my time," the worksheet is producing a fictional number.
- Forgetting the discount you always give. If every third customer gets 10% off, your effective price is not the sticker price. Our discount guide covers the volume you'd need to sell to break even on it.
- Setting the price once. Materials, rent, and processing rates all move. A worksheet you filled in two years ago is describing a business that no longer exists.
- Rounding down to a "nicer" number. Rounding $10.57 to $9.95 rather than $10.95 costs a full point of margin on every unit forever, in exchange for a psychological effect you have not tested.
Checklist
- Every material component weighed or counted, not estimated
- Your own labor included at a real hourly rate
- Overhead allocated across realistic volume, not hoped-for volume
- Card and platform fees solved into the price, not absorbed
- Price calculated by dividing by (1 − margin), not multiplying
- Wholesale margin checked before retail price was fixed
- Actual margin at the rounded price verified
- Break-even volume per month calculated
- Review date set in the calendar
FAQs
What should be in a pricing worksheet?+
Four blocks: direct costs (materials and labor), allocated overhead, variable selling costs such as card fees, and a target margin. The price falls out of those four rather than being chosen first and justified afterwards.
What is a good profit margin for a small business?+
There is no single number, and any page that gives you one is guessing. Margins vary enormously by industry — grocery runs on low single digits, software on 80%+. The useful benchmark is your own: last year's margin, and whether the number in front of you covers your overhead at realistic volume. Our [profit margin guide](/guides/how-to-calculate-profit-margin) covers how to read the figure once you have it.
Should I include my own labor if I'm a one-person business?+
Yes. If you don't, you cannot tell the difference between a profitable product and one that merely returns your own unpaid hours to you. It also makes the price impossible to defend when you eventually hire someone to do that work.
How do I allocate overhead if my sales volume changes month to month?+
Use a conservative annual average — total overhead for the year divided by units you are confident of selling in the year. Then re-check it quarterly. Allocating against an optimistic forecast is one of the most common ways a worksheet produces a price that doesn't work.
Do I need a different worksheet for services?+
Yes, and the second block above is it. Products build a price up from unit cost; services divide an annual target by billable hours. The mechanics are different enough that mixing them produces nonsense.
Is there a spreadsheet version?+
The blocks above paste straight into Google Sheets or Excel, one line per row, and the formulas are written next to the lines that need them. We deliberately don't gate a download behind an email form — the whole worksheet is on this page.
What to do next
Fill in the block that matches what you sell, then run the three numbers that turn a worksheet into a decision:
- [Profit Margin Calculator](/tools/profit-margin-calculator) — confirm the margin your rounded price actually delivers.
- [Break-Even Calculator](/tools/break-even-calculator) — find the monthly volume that covers your overhead at that price.
- [Hourly Rate Calculator](/tools/hourly-rate-calculator) — for the service worksheet, run the whole chain from target income to rate.
If the number that comes out is lower than you expected, that is the worksheet doing its job. The alternative was finding out from your bank balance in November.
Free tools to try
Keep reading
Guide
How to Price a Product for Retail (Step by Step)
How to price a product for retail: total your true costs, pick a pricing method, and set a price that hits a real profit margin. With a worked example.
Guide
Small Business Pricing Strategies: The Complete Guide
The pricing strategies that work for small businesses — cost-plus, value-based, tiered, and premium — how to choose one, and how to raise prices without losing customers.
Guide
How to Set Your Hourly Rate (What to Charge)
Work out what to charge per hour: target income, real expenses, self-employment tax, and billable hours — with a formula and a full worked example.