How-to guide
Break-Even Analysis: A Step-by-Step Guide
Break-even analysis answers the most grounding question in business: *how much do I need to sell before I stop losing money?* Below the break-even point, every day you're subsidizing the business out of your own pocket. Above it, every additional sale is profit. Knowing exactly where that line sits turns vague anxiety ("are we okay?") into a concrete target ("we need 1,200 sales a month") — and a target is something you can actually plan around. It's a cornerstone of financial planning: the Corporate Finance Institute treats the break-even point as a fundamental check on whether a product, price, or expansion will actually pay.
It's also one of the most useful calculations you can run *before* you commit money — to a new product, a bigger space, a hire, or a price change. This guide explains the three numbers you need, walks through the formula step by step, and works a full example for a food truck so you can find your own break-even point in a few minutes.
What is break-even, and the formula
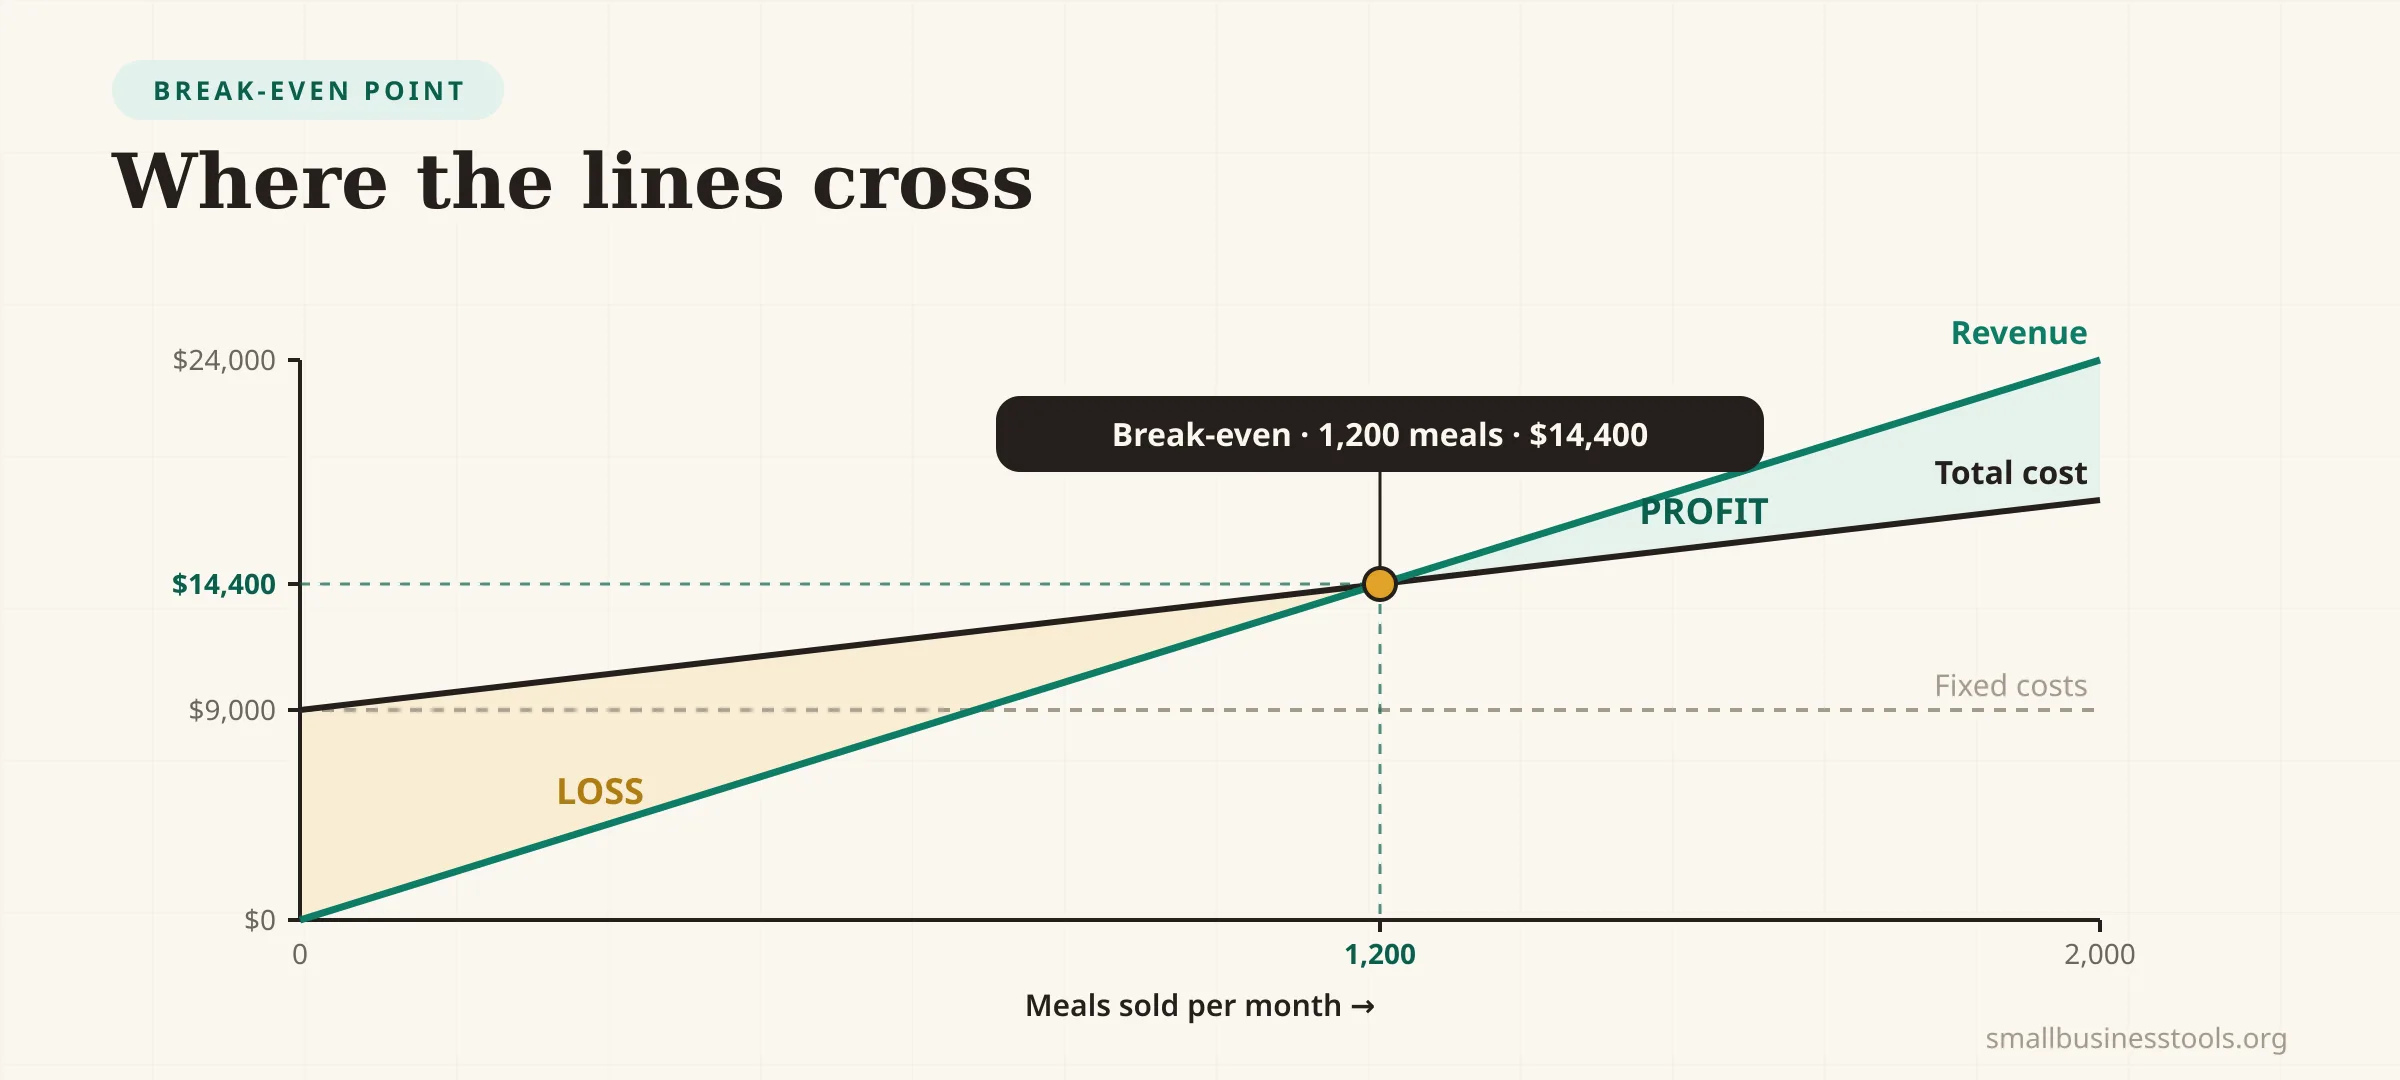
Your break-even point is the sales level where total revenue exactly equals total costs — zero profit, zero loss. Sell one more and you're in profit; sell one fewer and you're in the red.
To find it, you need three numbers:
Where contribution margin per unit = price − variable cost per unit. That's the whole model. The rest of this guide is understanding those terms so your numbers are honest.
The three numbers you need
Fixed costs
Fixed costs are what you pay no matter how much you sell — they don't move with sales volume. Rent, insurance, a loan or equipment payment, salaried staff, software subscriptions, permits. Whether you sell zero units or ten thousand this month, these bills arrive. Total them for the period you're analyzing (usually a month).
Variable costs
Variable costs rise and fall with each unit sold. For a product: materials, packaging, payment processing, and shipping. For a food truck: the ingredients and container for each meal. If you sell nothing, you incur no variable cost; each sale adds a predictable amount. What matters for the formula is the variable cost per unit.
Contribution margin
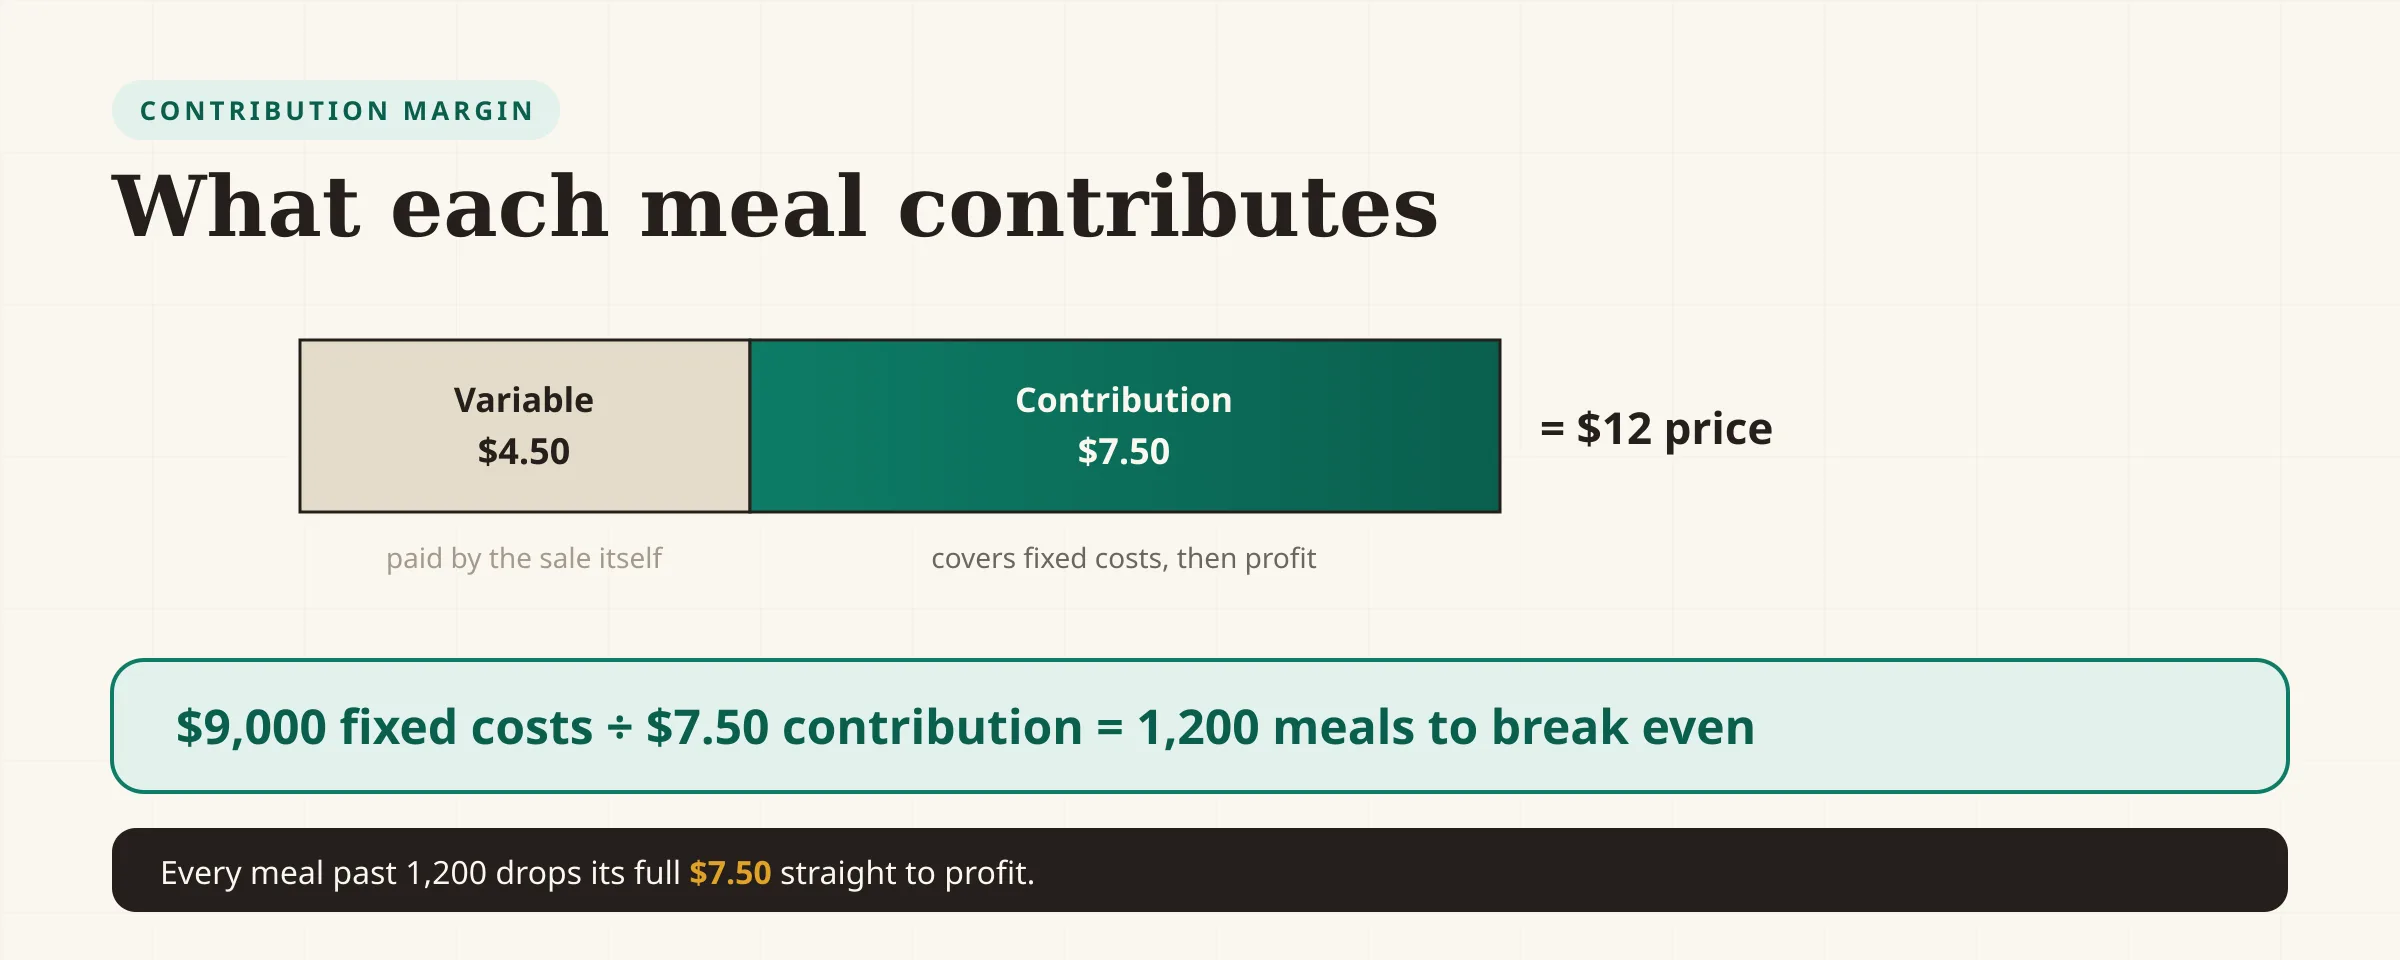
Contribution margin is what each sale *contributes* toward covering your fixed costs, after its own variable cost is paid:
If a meal sells for $12 and costs $4.50 in ingredients and packaging, each meal contributes $12 − $4.50 = $7.50 toward the fixed costs. Once enough meals have stacked up $7.50 at a time to cover all the fixed costs, you've broken even — and every meal after that drops its $7.50 straight to profit.
How to calculate break-even, step by step
- Total your fixed costs for the period (e.g. one month). Include everything that doesn't change with sales.
- Find your variable cost per unit. Add up the per-sale costs of one unit.
- Calculate contribution margin per unit: price − variable cost per unit.
- Divide fixed costs by contribution margin to get break-even in units.
- Multiply by price (or divide fixed costs by the contribution margin *ratio*) to get break-even in revenue dollars.
For revenue directly: Break-even revenue = Fixed costs ÷ (Contribution margin ÷ Price). The Break-Even Calculator runs all of this at once — enter fixed costs, price, and variable cost, and it returns the break-even point in both units and dollars.
Worked example: a food truck
A food truck owner wants to know how many meals a month keeps the lights on.
The numbers:
- Price per meal: $12
- Variable cost per meal (ingredients, packaging): $4.50
- Fixed costs per month (truck payment, permits, insurance, one part-time wage): $9,000
The calculation:
- Contribution margin =
$12 − $4.50 =$7.50 per meal - Break-even units =
$9,000 ÷ $7.50 =1,200 meals a month - Break-even revenue =
1,200 × $12 =$14,400 a month
Now it's real: across ~26 trading days, that's about 46 meals a day just to break even. Below 46, the truck loses money; above it, each meal adds $7.50 of profit. That single number tells the owner whether the pitch, the hours, and the price actually add up — before betting a season on it.
Using break-even for real decisions
Break-even isn't just a survival check — it's a decision tool:
- Set a sales target with profit built in. To find the volume for a target profit, add it to fixed costs:
(Fixed costs + Target profit) ÷ Contribution margin. For $3,000 monthly profit:($9,000 + $3,000) ÷ $7.50 = 1,600 meals. - Test a price change. Raising the price to $13 lifts contribution to $8.50 and drops break-even to
9,000 ÷ 8.50 = 1,059 meals— 141 fewer sales needed. Break-even shows the leverage a small price increase carries. (See how to price a product.) - Vet a new cost before you commit. Thinking of a $1,500/month second location or hire? Add it to fixed costs and see how many extra sales it demands. If the answer is unrealistic, you have your answer.
- Sanity-check a discount. Cutting price shrinks contribution margin and *raises* break-even. The Discount Calculator and Profit Margin Calculator show the knock-on effect before you promote.
Common mistakes
- Miscategorizing costs. Putting a variable cost in the fixed bucket (or vice versa) throws off everything. Ask: "does this bill change if I sell one more unit?" If yes, it's variable.
- Forgetting to pay yourself. If your own wage isn't in fixed costs, breaking even really means breaking even *while working for free*. Include a realistic wage — the Hourly Rate Calculator helps set it.
- Assuming one price and one product. With a mix of products at different margins, use a blended average contribution margin, or run break-even per product line.
- Treating it as one-and-done. Costs and prices drift. Recalculate when rent rises, materials jump, or you change pricing.
- Ignoring capacity. If break-even needs 46 meals a day but you can only serve 40, the model is telling you the plan doesn't work as-is — listen to it.
Checklist
- Total all fixed costs for the month (including your own wage)
- Work out the variable cost of one unit
- Contribution margin = price − variable cost per unit
- Break-even units = fixed costs ÷ contribution margin
- Convert to revenue and to a per-day target
- Compare the target to your realistic capacity
- Re-run it for target-profit, price-change, and new-cost scenarios
FAQs
What is break-even analysis?+
Break-even analysis calculates the sales level at which total revenue equals total costs, so you make neither a profit nor a loss. Below it you're losing money; above it, each sale is profit. It's used to set sales targets and to test decisions like pricing changes, new hires, or expansions before committing.
What is the break-even formula?+
Break-even in units equals fixed costs divided by the contribution margin per unit, where contribution margin is price minus variable cost per unit. For revenue, multiply the break-even units by price, or divide fixed costs by the contribution margin ratio. The [Break-Even Calculator](/tools/break-even-calculator) computes both.
What's the difference between fixed and variable costs?+
Fixed costs stay the same regardless of sales — rent, insurance, loan payments, salaries. Variable costs change with each unit sold — materials, packaging, shipping, transaction fees. The distinction is central to break-even: fixed costs are what you must cover, variable costs determine each sale's contribution.
What is contribution margin?+
Contribution margin is the amount each sale contributes toward fixed costs after covering its own variable cost: price minus variable cost per unit. If a $12 meal has $4.50 of variable cost, its contribution margin is $7.50. Total fixed costs divided by this figure gives the break-even quantity.
How do I calculate break-even in dollars instead of units?+
Divide fixed costs by the contribution margin ratio (contribution margin ÷ price). With $9,000 fixed costs and a ratio of `7.50 ÷ 12 = 0.625`, break-even revenue is `9,000 ÷ 0.625 = $14,400`. Or simply multiply break-even units by the price.
How do I find the sales needed for a target profit?+
Add your target profit to fixed costs, then divide by the contribution margin per unit. For $3,000 profit on top of $9,000 fixed costs at a $7.50 margin: `(9,000 + 3,000) ÷ 7.50 = 1,600 units`. It's the break-even formula with profit treated as an extra fixed cost to cover.
Final take
Break-even analysis turns "are we okay?" into a specific, plannable number: fixed costs divided by contribution margin (price minus variable cost) gives the sales level where you stop losing and start earning. Total your costs honestly — including your own wage — run them through the Break-Even Calculator, and then use the model to test prices, targets, and new costs before you spend a dollar. It's the calculation that tells you whether the plan works before reality does.
Free tools to try
Keep reading
Guide
Small Business Pricing Strategies: The Complete Guide
The pricing strategies that work for small businesses — cost-plus, value-based, tiered, and premium — how to choose one, and how to raise prices without losing customers.
Guide
How to Set Your Hourly Rate (What to Charge)
Work out what to charge per hour: target income, real expenses, self-employment tax, and billable hours — with a formula and a full worked example.
Guide
How to Price a Product for Retail (Step by Step)
How to price a product for retail: total your true costs, pick a pricing method, and set a price that hits a real profit margin. With a worked example.
Guide
How to Calculate Profit Margin (Formula + Examples)
How to calculate profit margin step by step — the formula, the difference between gross, operating, and net margin, and worked examples with real numbers.